Pay once and keep it in your own Google Drive. Browse templates
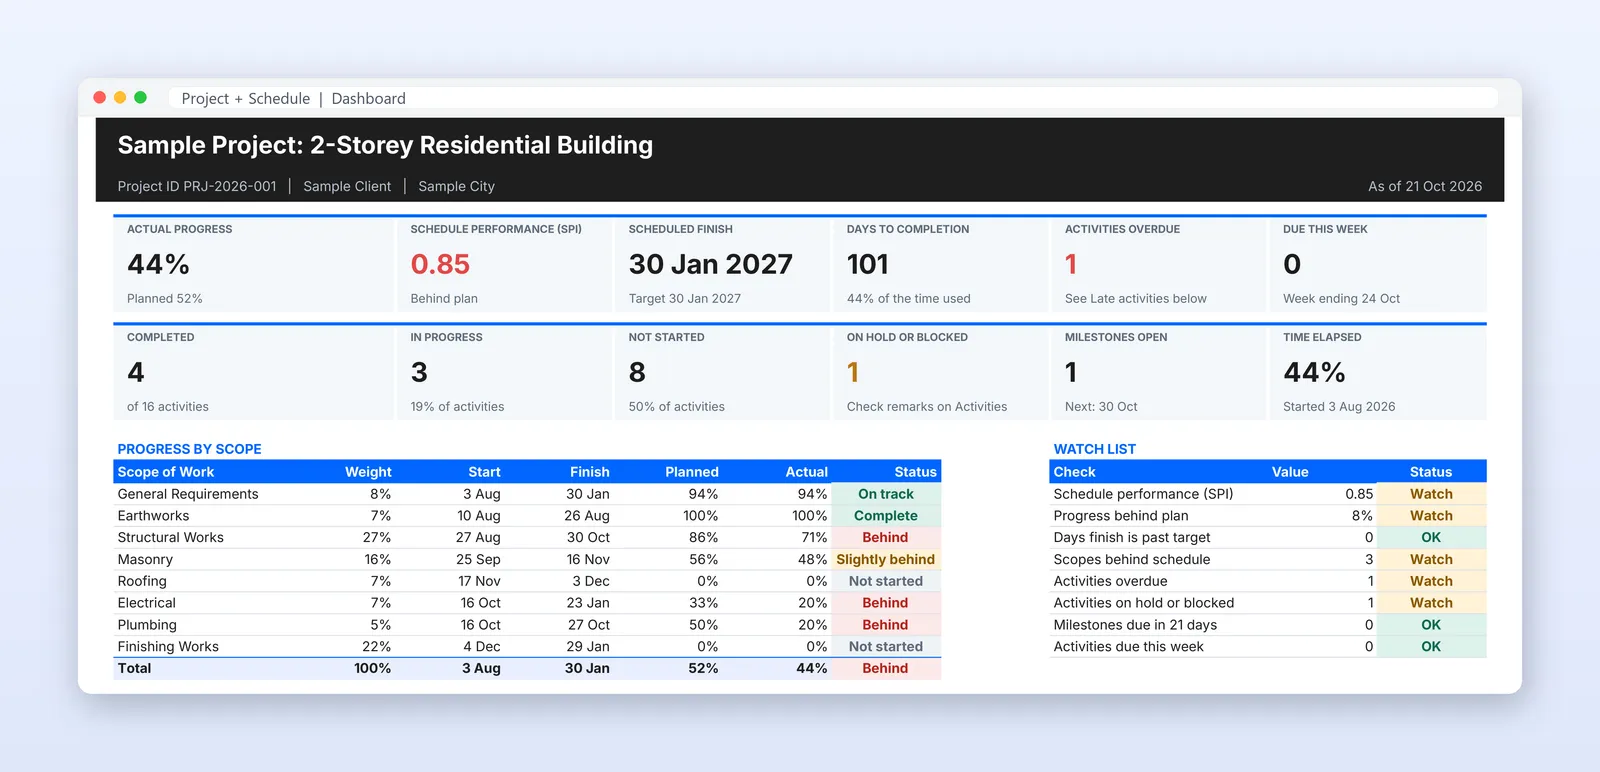
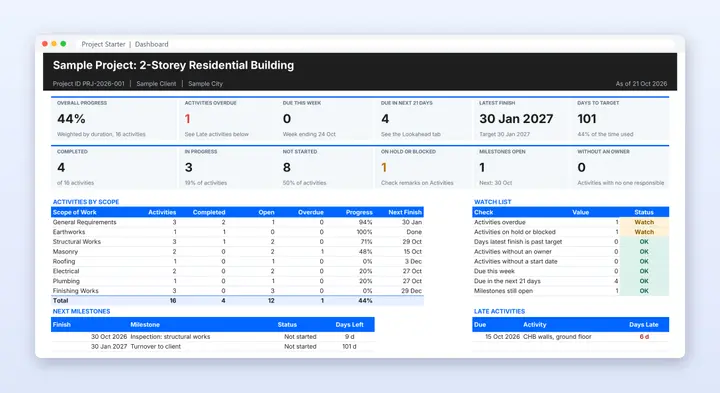
Dashboard: progress, SPI, finish date and overdue items. All data shown is fictional sample data.
₱900about $16 USD
Know if you are behind before the client tells you.
Link activities with dependencies, see them on a Gantt chart and compare planned against actual progress every week.
Made for: Site engineers and project managers who live by the schedule
Schedule control for one project: activities linked by dependencies, a Gantt chart, planned vs actual progress and a 3-week lookahead.
Progress, SPI (are you ahead or behind), finish date, overdue items, progress by scope, and charts.
You type here? No
Project details, report date, alert levels, scopes of work, holidays and work calendar.
You type here? Yes, the yellow cells
Progress rolled up by scope, with planned dates, status and a weekly Gantt.
You type here? No
One row per task, with its predecessor (the task it waits for), lag, duration, % complete and status. Start and finish dates are calculated, and the Gantt bars follow.
You type here? Yes
Everything overdue, plus everything finishing in the next 3 weeks.
You type here? No
Planned vs actual progress per week, for the S-curve.
You type here? Only column N (actual progress)
Project + Schedule₱900
You need: a free Google account. The templates work in Google Sheets on a computer, tablet or phone. Setting up is easiest on a computer, and day-to-day updates work fine on a phone.
Start small and upgrade later by paying only the difference. Email us to upgrade.
| What you get | Starter | + Schedule | + Budget | Most popularControls | Ultimate |
|---|---|---|---|---|---|
| Project setup, scopes of work, work calendar and holidays | |||||
| Activity tracker with owners, status and % complete | |||||
| Dashboard and 3-week lookahead | |||||
| Task dependencies and calculated start and finish dates | – | – | |||
| Gantt chart with a movable timeline | – | – | |||
| Planned vs actual progress (S-curve) and SPI | – | – | |||
| Cost log (actual spend, and ETC: the money still to spend) | – | – | |||
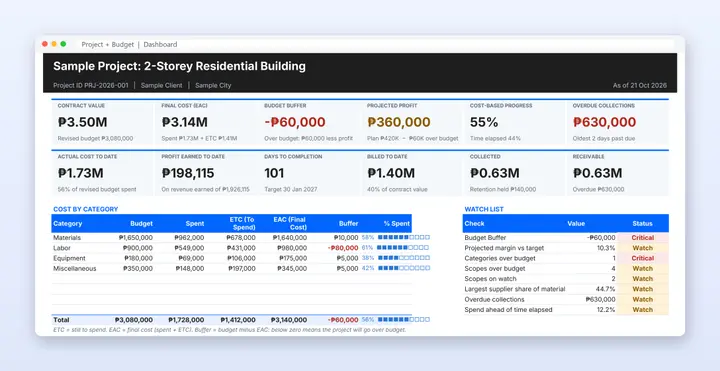
| Budget by category and scope, Budget Buffer, final cost (EAC) | – | – | |||
| Project P&L | – | – | |||
| Billing, retention and collections | – | – | |||
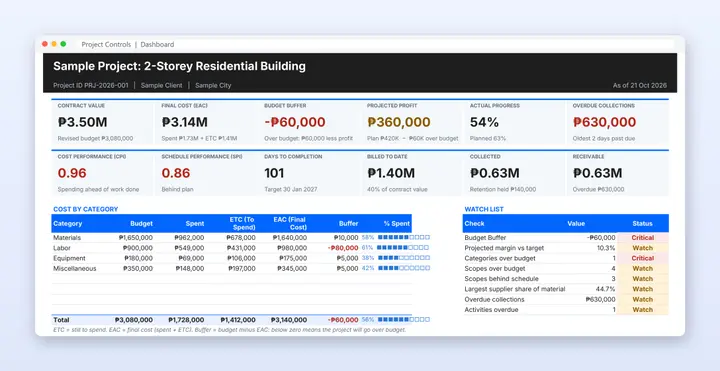
| Earned value: CPI, SPI, EAC on one dashboard | – | – | – | ||
| Portfolio dashboard across all projects | – | – | – | – | |
| Portfolio milestones and all-deliverables list | – | – | – | – | |
| Price | ₱250 | ₱900 | ₱1,500 | ₱2,200 | ₱3,500 |
No. You need a free Google account. The file opens in Google Sheets on a computer, tablet or phone.
After your payment is confirmed, you get an email with a Make a copy link for each template. The same links are on your My Orders page. Click the link, choose Make a copy, and the file is saved in your own Google Drive.
Scan our payment QR code at checkout. We confirm your payment and email your templates, usually within 24 hours. Online payment by GCash, Maya and card is coming soon.
No. Checkout uses your email address only, so please type it carefully.
No. Your copy belongs to you. We never see what you type.
Yes. Email us, pay only the difference between your tier and the new one, and we send the new template.
Yes, within 7 days if the template is not right for you.
The project templates are set up for construction (materials, labor, equipment and miscellaneous), but the categories and scopes are editable, so they work for fit-outs, renovations and other projects too.
ETC (estimate to complete) is the money you still expect to spend to finish the project. EAC (estimate at completion) is the final cost: what you have spent so far plus the ETC. Budget Buffer is the budget minus the EAC. Above zero, that money is left over. Below zero, the project will go over budget, and the sheet shows it in red so you can act early. Project Controls also shows CPI and SPI: below 1.00 means you are spending more than the work done is worth (CPI) or running behind schedule (SPI).